📡 RF Signal Detection System | SDR Pipeline
A real-time RF signal detection project using an RTL-SDR, Python, FFT-based spectrum analysis, threshold detection, clustering, CSV logging, and persistent signal analysis. This project serves as the software reference model for a future FPGA-accelerated signal processing engine.
Overview
This project is a real-time RF sensing pipeline built around a Nooelec NESDR SMArt v5 software-defined radio. The system captures live IQ samples from the SDR, computes a frequency-domain power spectrum using the FFT, detects signal candidates above a dynamic noise threshold, clusters nearby FFT bins into signal regions, merges duplicate detections, and logs RF activity to a CSV file for persistence analysis.
I first validated the DSP pipeline using simulated IQ signals, then swapped the input source to live SDR hardware without rewriting the processing chain. This gave the project a clean modular structure and made the hardware integration straightforward.
Project Goals
- Build a real RF signal detection system using an RTL-SDR
- Capture and process live IQ samples from an antenna
- Compute FFT-based power spectra from raw RF samples
- Detect signal candidates using a dynamic noise-floor threshold
- Cluster and merge nearby frequency bins into cleaner signal detections
- Log detections to CSV for later analysis
- Create a software reference model for future FPGA acceleration
System Architecture
The system is structured as a modular DSP pipeline. The antenna receives RF energy from nearby transmitters, the RTL-SDR downconverts and digitizes the signal, and the Python pipeline analyzes the resulting IQ samples.
source.py provides either simulated test signals or live SDR data without changing the rest of the pipeline.
dsp.py converts time-domain IQ samples into a frequency-domain power spectrum and maps FFT bins to frequency offsets.
detection.py estimates the noise floor and flags FFT bins whose power exceeds a dynamic threshold.
clustering.py groups adjacent high-power FFT bins into rough signal regions.
mergeDetection.py merges nearby detections into cleaner signal objects with center frequency, bandwidth, and power metrics.
main.py prints detected signals and visualizes the live RF spectrum, threshold, and detected signal centers.
logger.py stores detections to CSV and analyzeDetections.py identifies persistent RF activity over time.
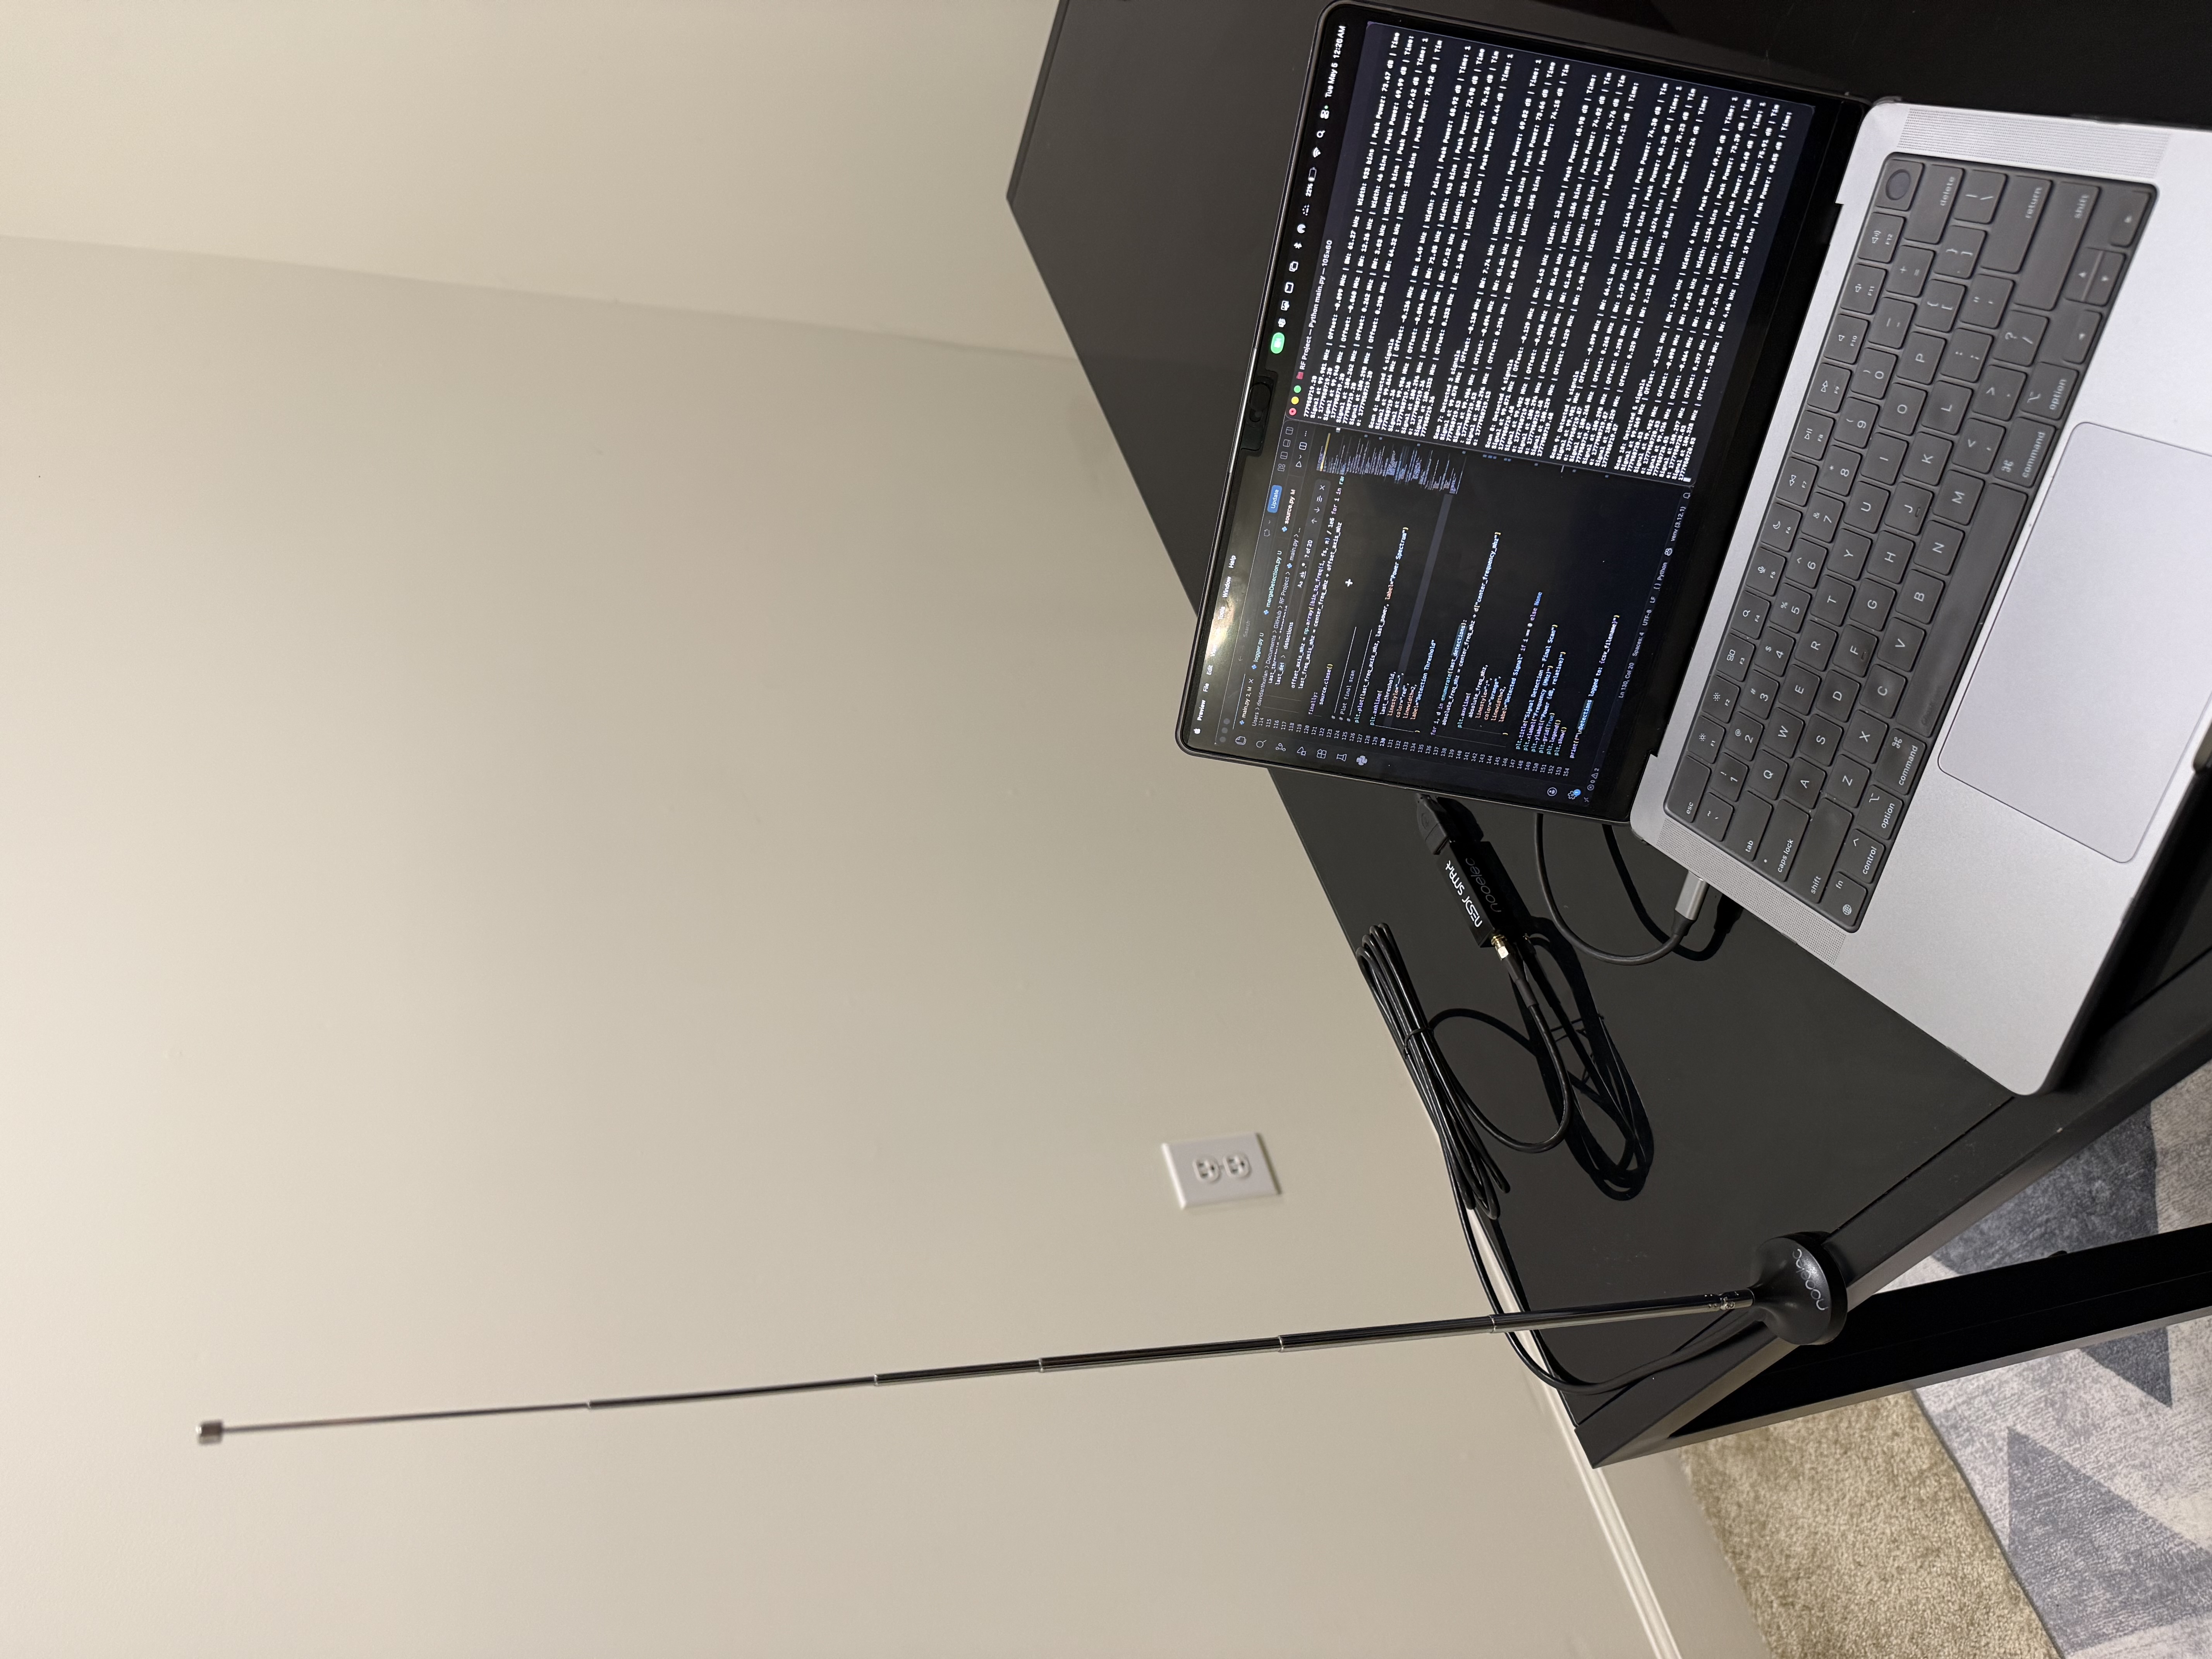
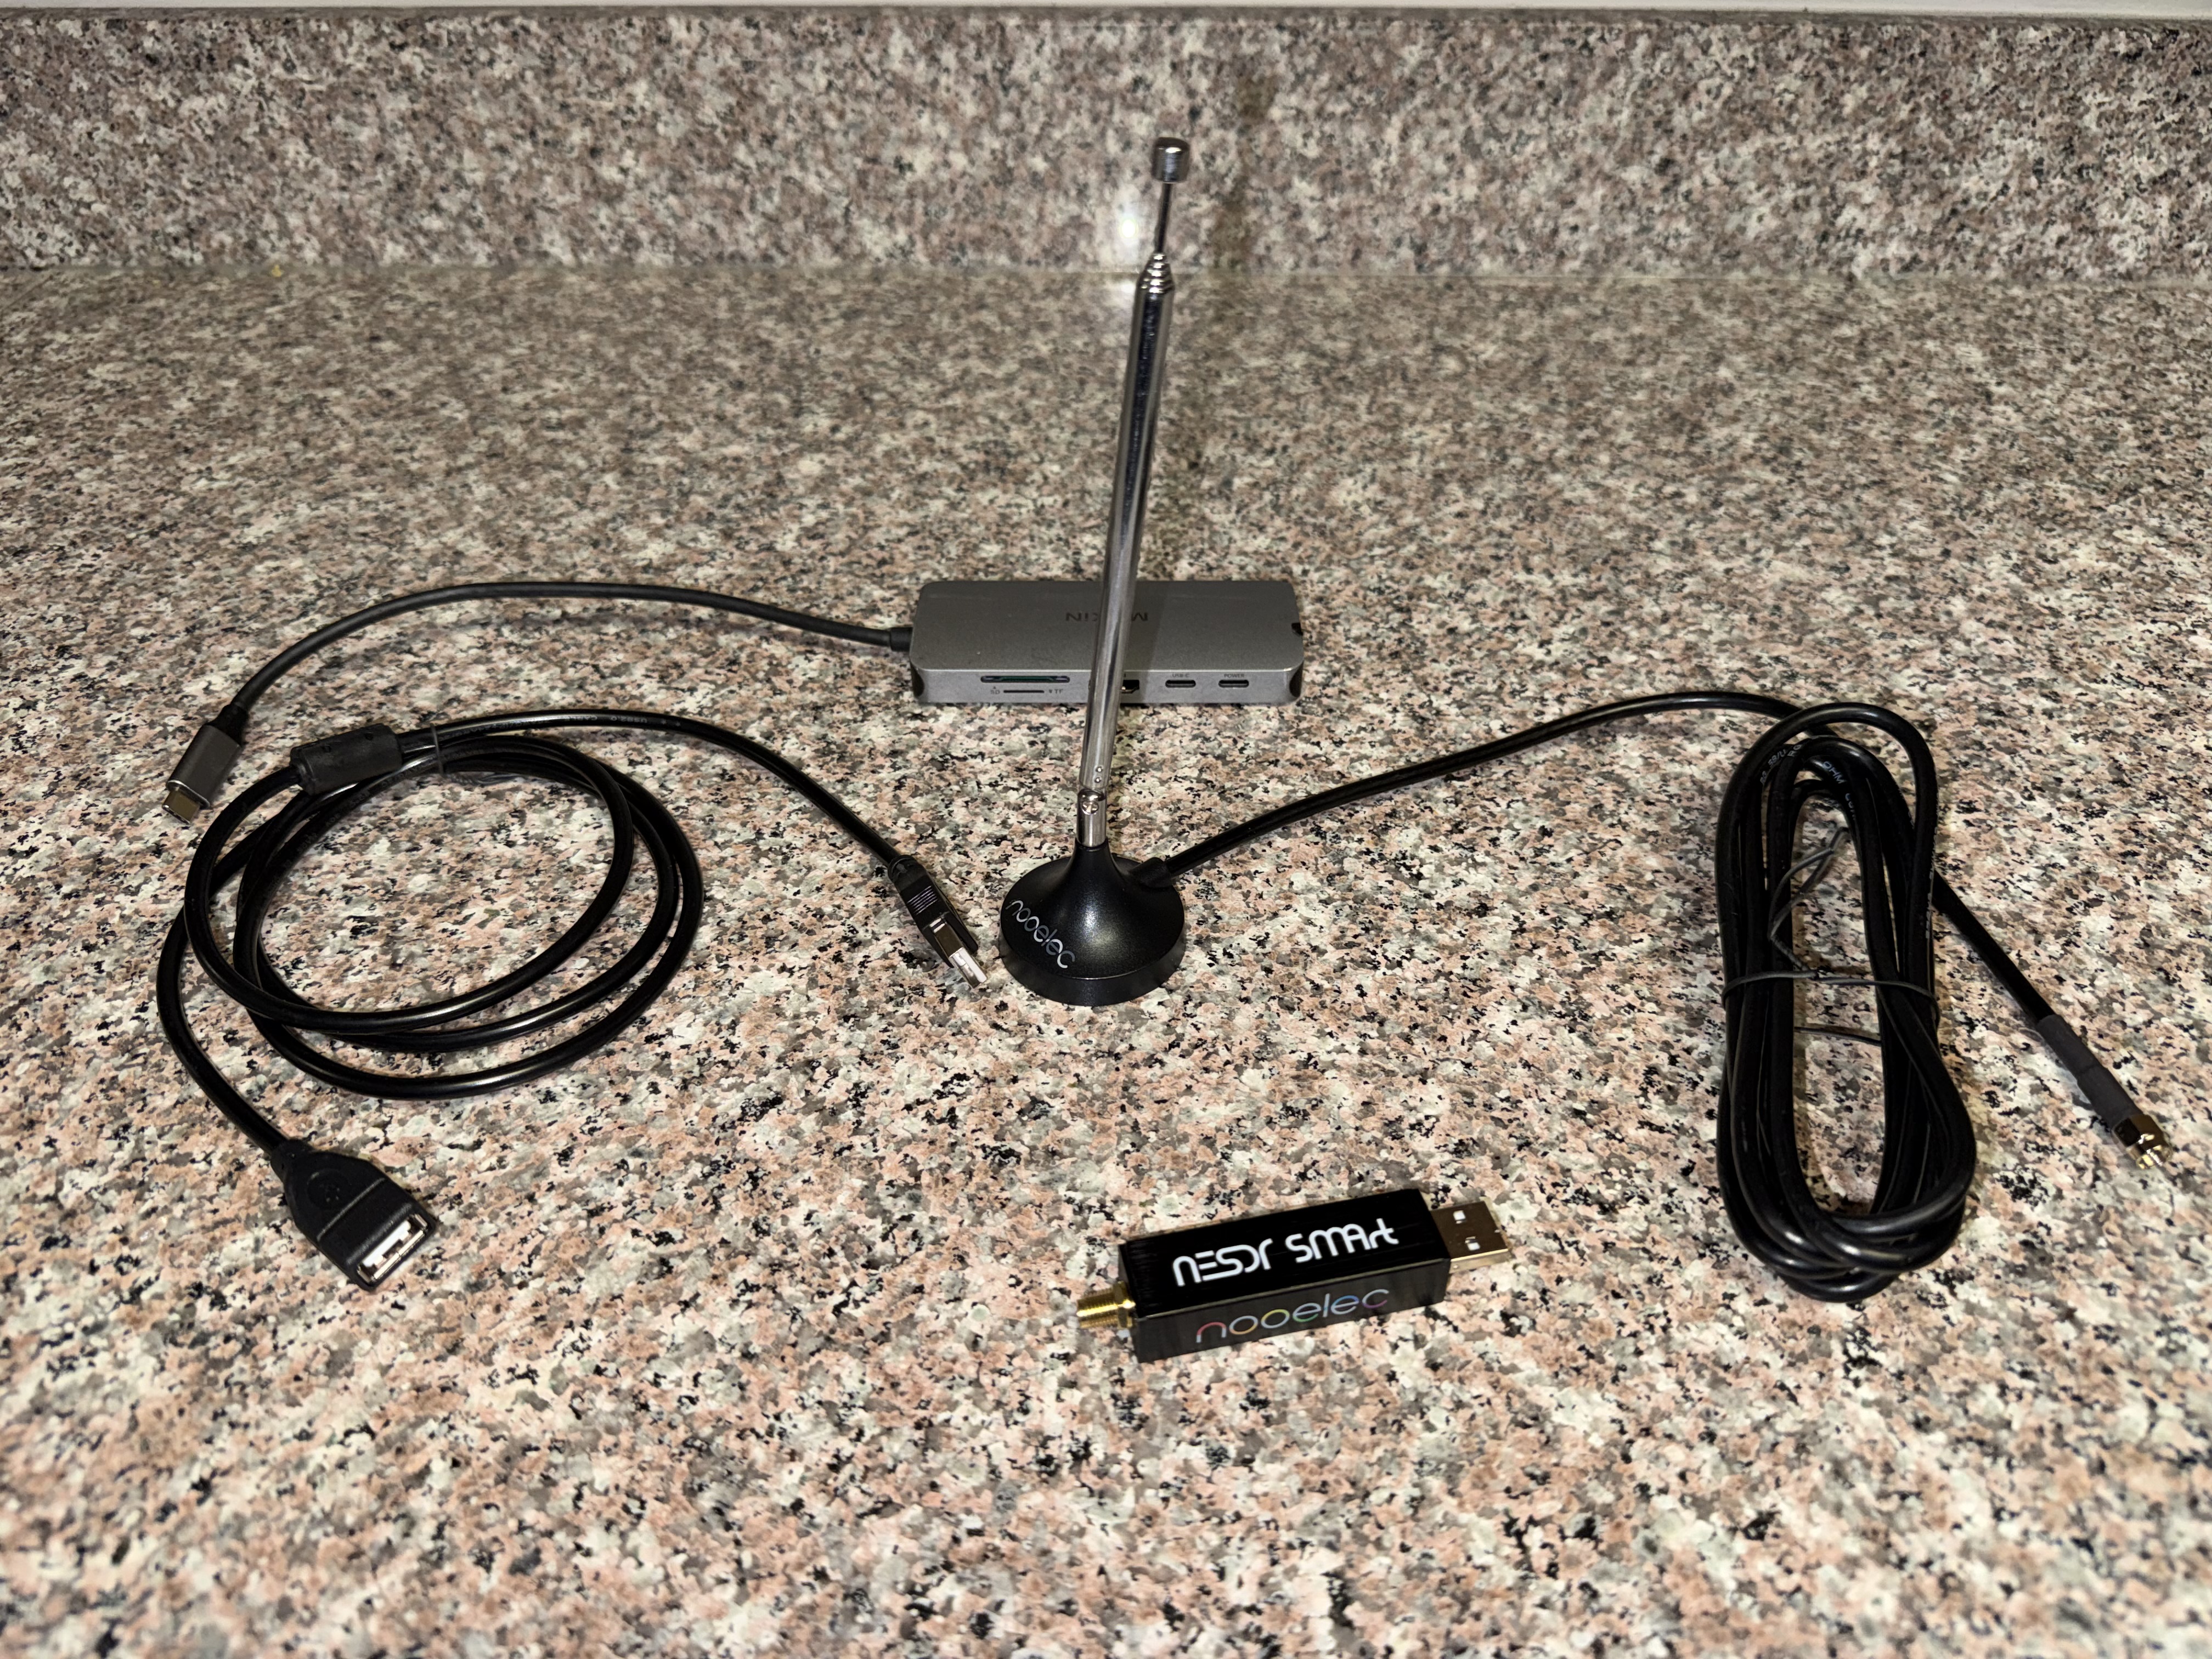
Hardware Setup
The hardware setup uses a Nooelec NESDR SMArt v5 RTL-SDR dongle, a USB extension cable, an SMA antenna base, and interchangeable antennas. The SDR is connected to a MacBook and controlled through Python and RTL-SDR command-line tools.
- Nooelec NESDR SMArt v5 RTL-SDR
- USB extension cable
- SMA antenna adapter and magnetic antenna base
- Telescopic antenna for FM broadcast reception
- Python virtual environment on macOS
Software Pipeline
The project is split into multiple Python modules so each part of the system has a specific responsibility.
- main.py: orchestrates the full pipeline from SDR capture to plotting and logging
- source.py: selects either simulated IQ data or live SDR samples
- sim.py: generates test signals for validating the DSP pipeline before hardware integration
- dsp.py: computes FFT power spectra and maps FFT bins to frequency offsets
- detection.py: estimates the noise floor and finds bins above a threshold
- clustering.py: groups nearby FFT bins into rough signal regions
- mergeDetection.py: merges nearby detections into cleaner signal objects
- logger.py: logs detections to CSV for later analysis
- analyzeDetections.py: summarizes persistent signals across scans
Live Spectrum Detection
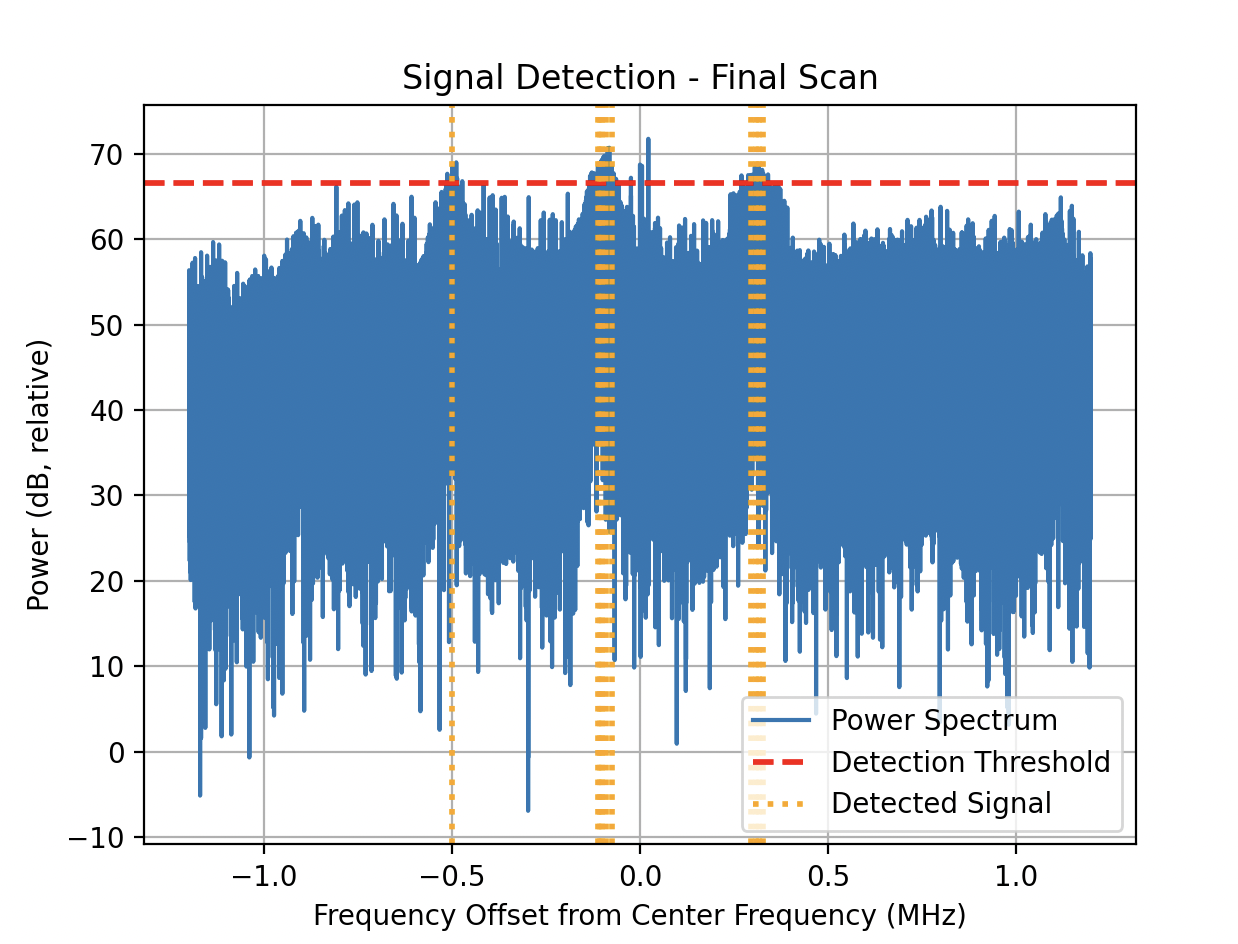
The SDR was tuned around the FM broadcast band. With a center frequency of 100 MHz and a 2.4 MS/s sample rate, the system analyzed roughly a 2.4 MHz slice of spectrum from about 98.8 MHz to 101.2 MHz.
The plot below shows the power spectrum from a live SDR capture. The blue trace is relative RF power, the red dashed line is the detection threshold, and the orange vertical lines mark detected signal centers.
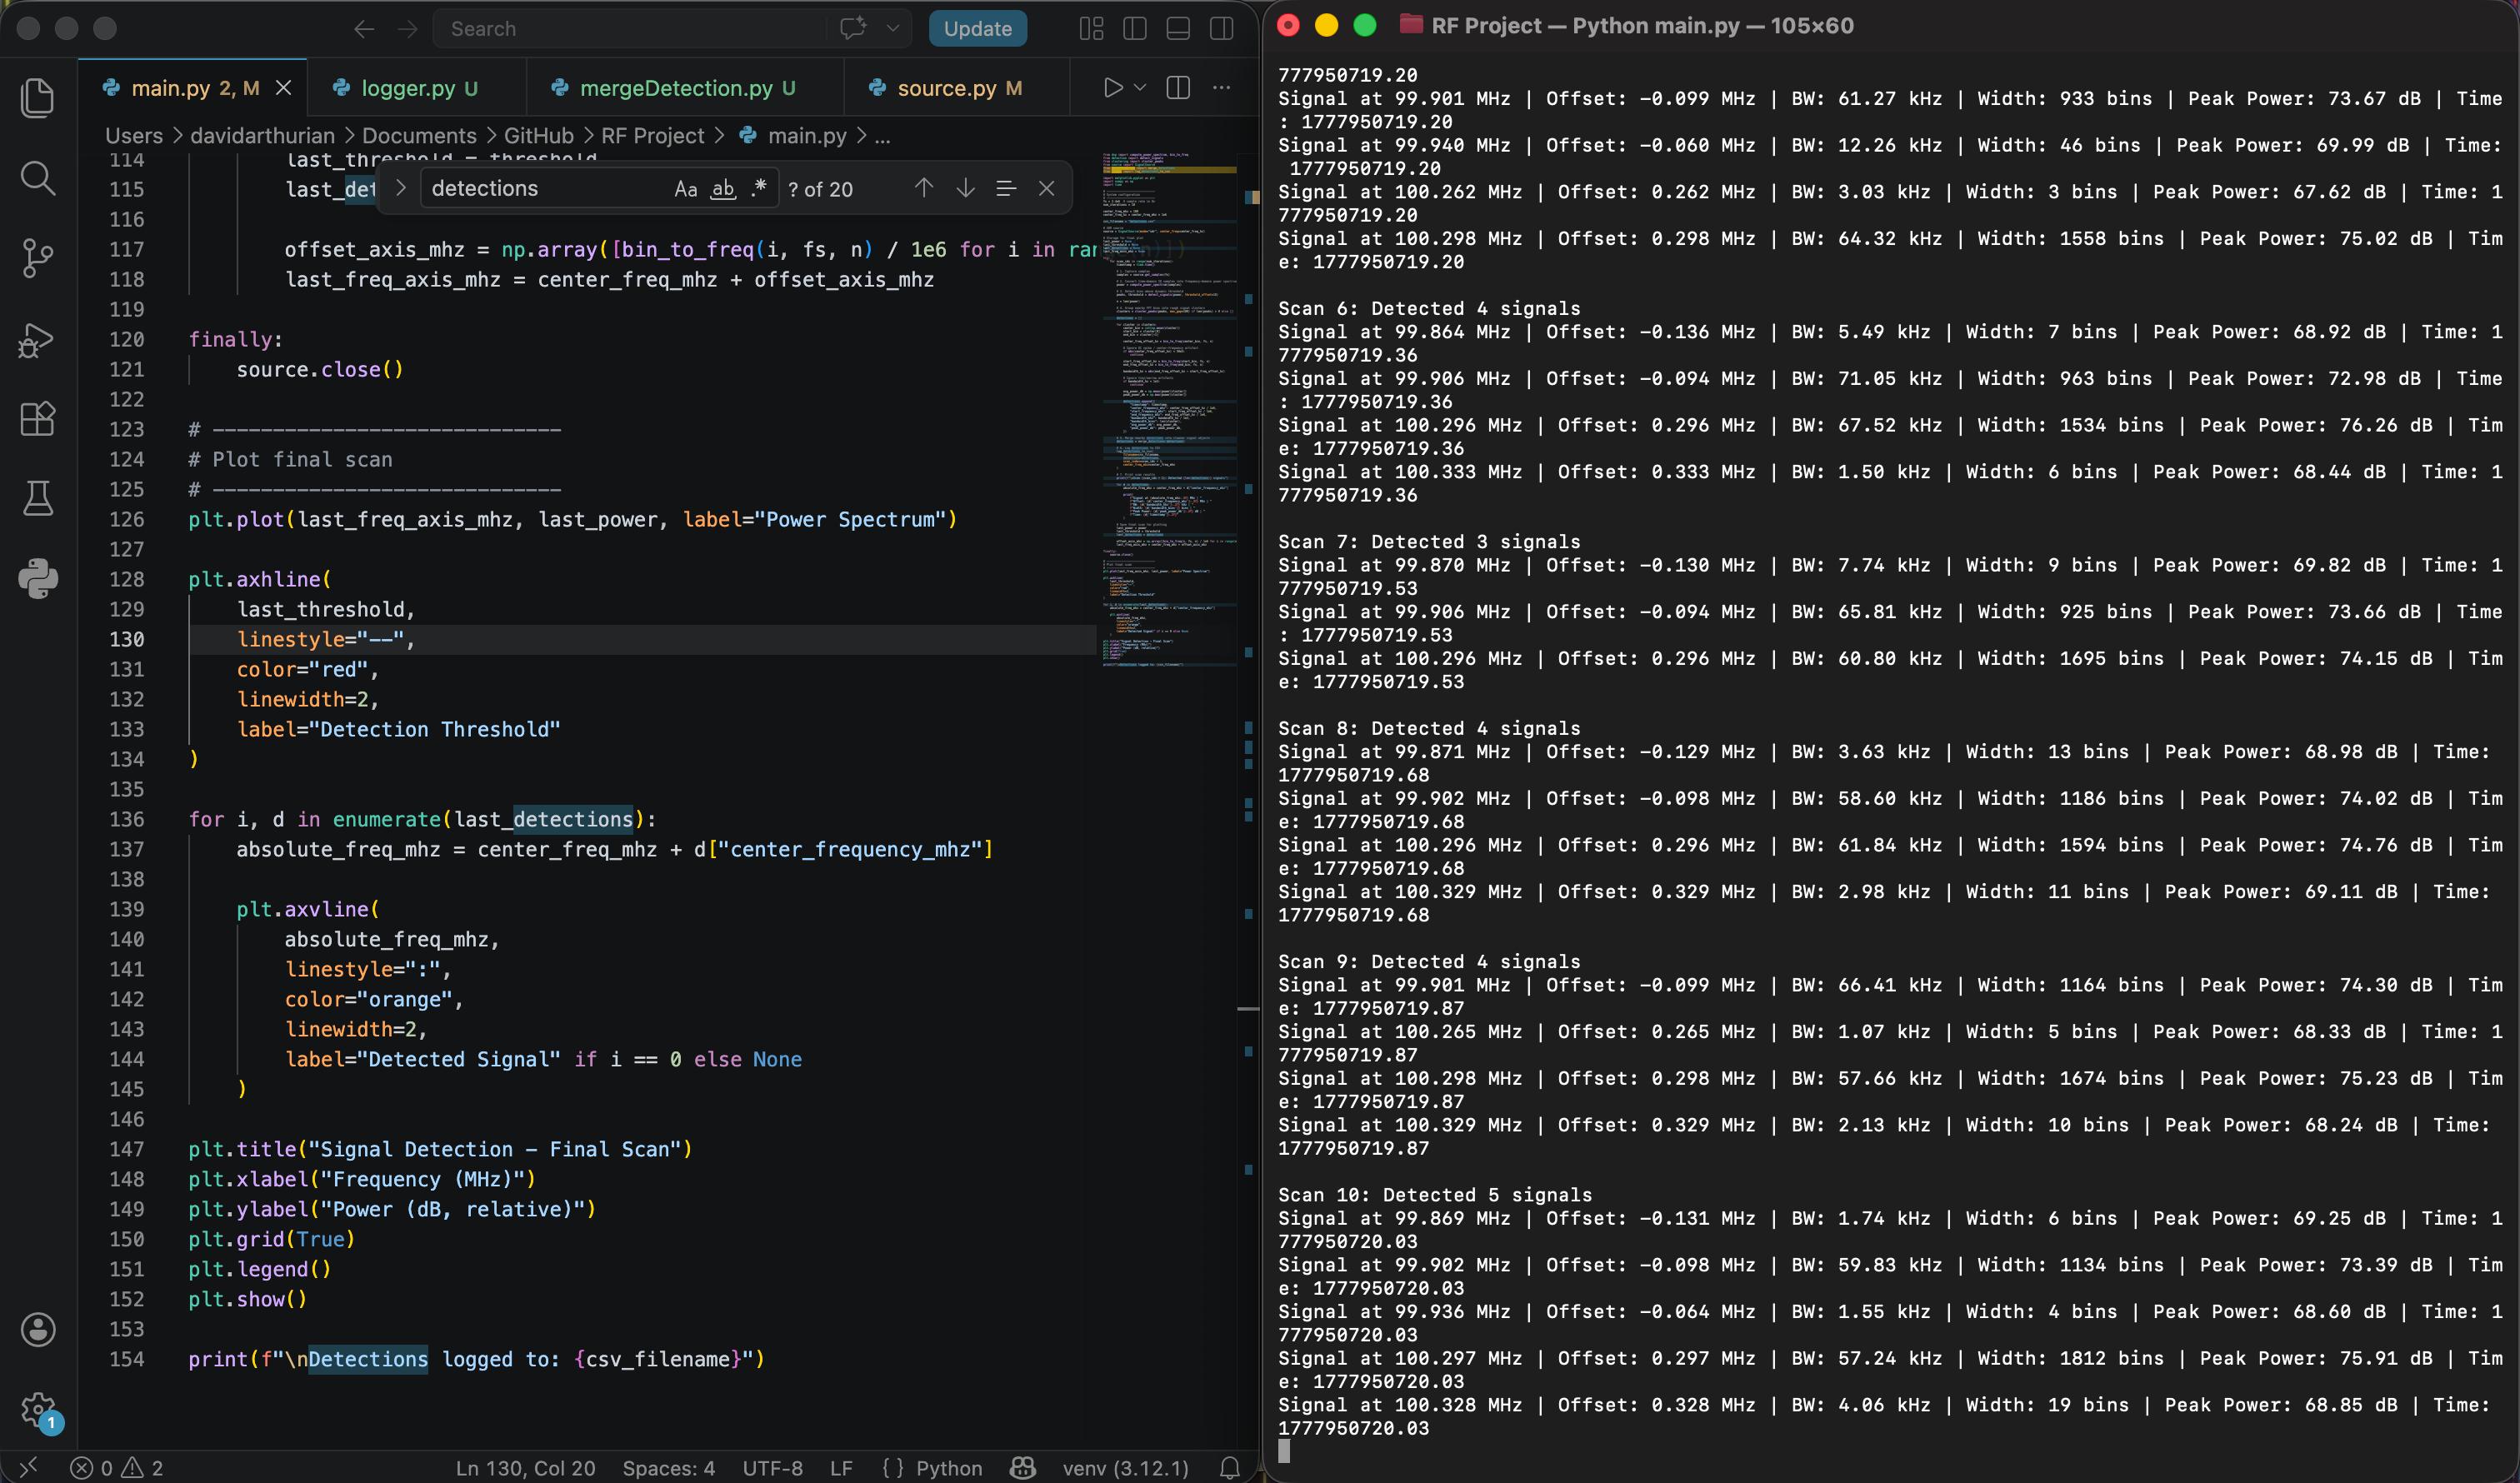
Example Terminal Output
After tuning the SDR and running the detection pipeline, the system produced live detections showing absolute frequency, offset from the SDR center frequency, estimated bandwidth, FFT bin width, relative peak power, and timestamp.
Scan 1: Detected 2 signals
Signal at 99.920 MHz | Offset: -0.080 MHz | BW: 25.38 kHz | Width: 5 bins | Peak Power: 70.00 dB
Signal at 100.290 MHz | Offset: 0.290 MHz | BW: 1.21 kHz | Width: 3 bins | Peak Power: 66.95 dB

Scan 2: Detected 3 signals
Signal at 99.904 MHz | Offset: -0.096 MHz | BW: 28.73 kHz | Width: 12 bins | Peak Power: 71.37 dB
Signal at 99.926 MHz | Offset: -0.074 MHz | BW: 3.52 kHz | Width: 6 bins | Peak Power: 67.51 dB
Signal at 100.314 MHz | Offset: 0.314 MHz | BW: 18.08 kHz | Width: 4 bins | Peak Power: 71.86 dB
Persistent Signal Analysis
After logging detections to CSV, I wrote an analysis script to group repeated detections over time. The system identified two persistent RF regions near 99.9 MHz and 100.3 MHz. These are likely FM broadcast signals within the local RF environment.
Persistent Signal Summary

 center_frequency_mhz  detections  unique_scans  avg_bandwidth_khz  avg_peak_power_db  max_peak_power_db
           100.303612          49            10          31.542159          71.720043          79.204590
            99.899290          54            10          27.125888          70.277979          74.629333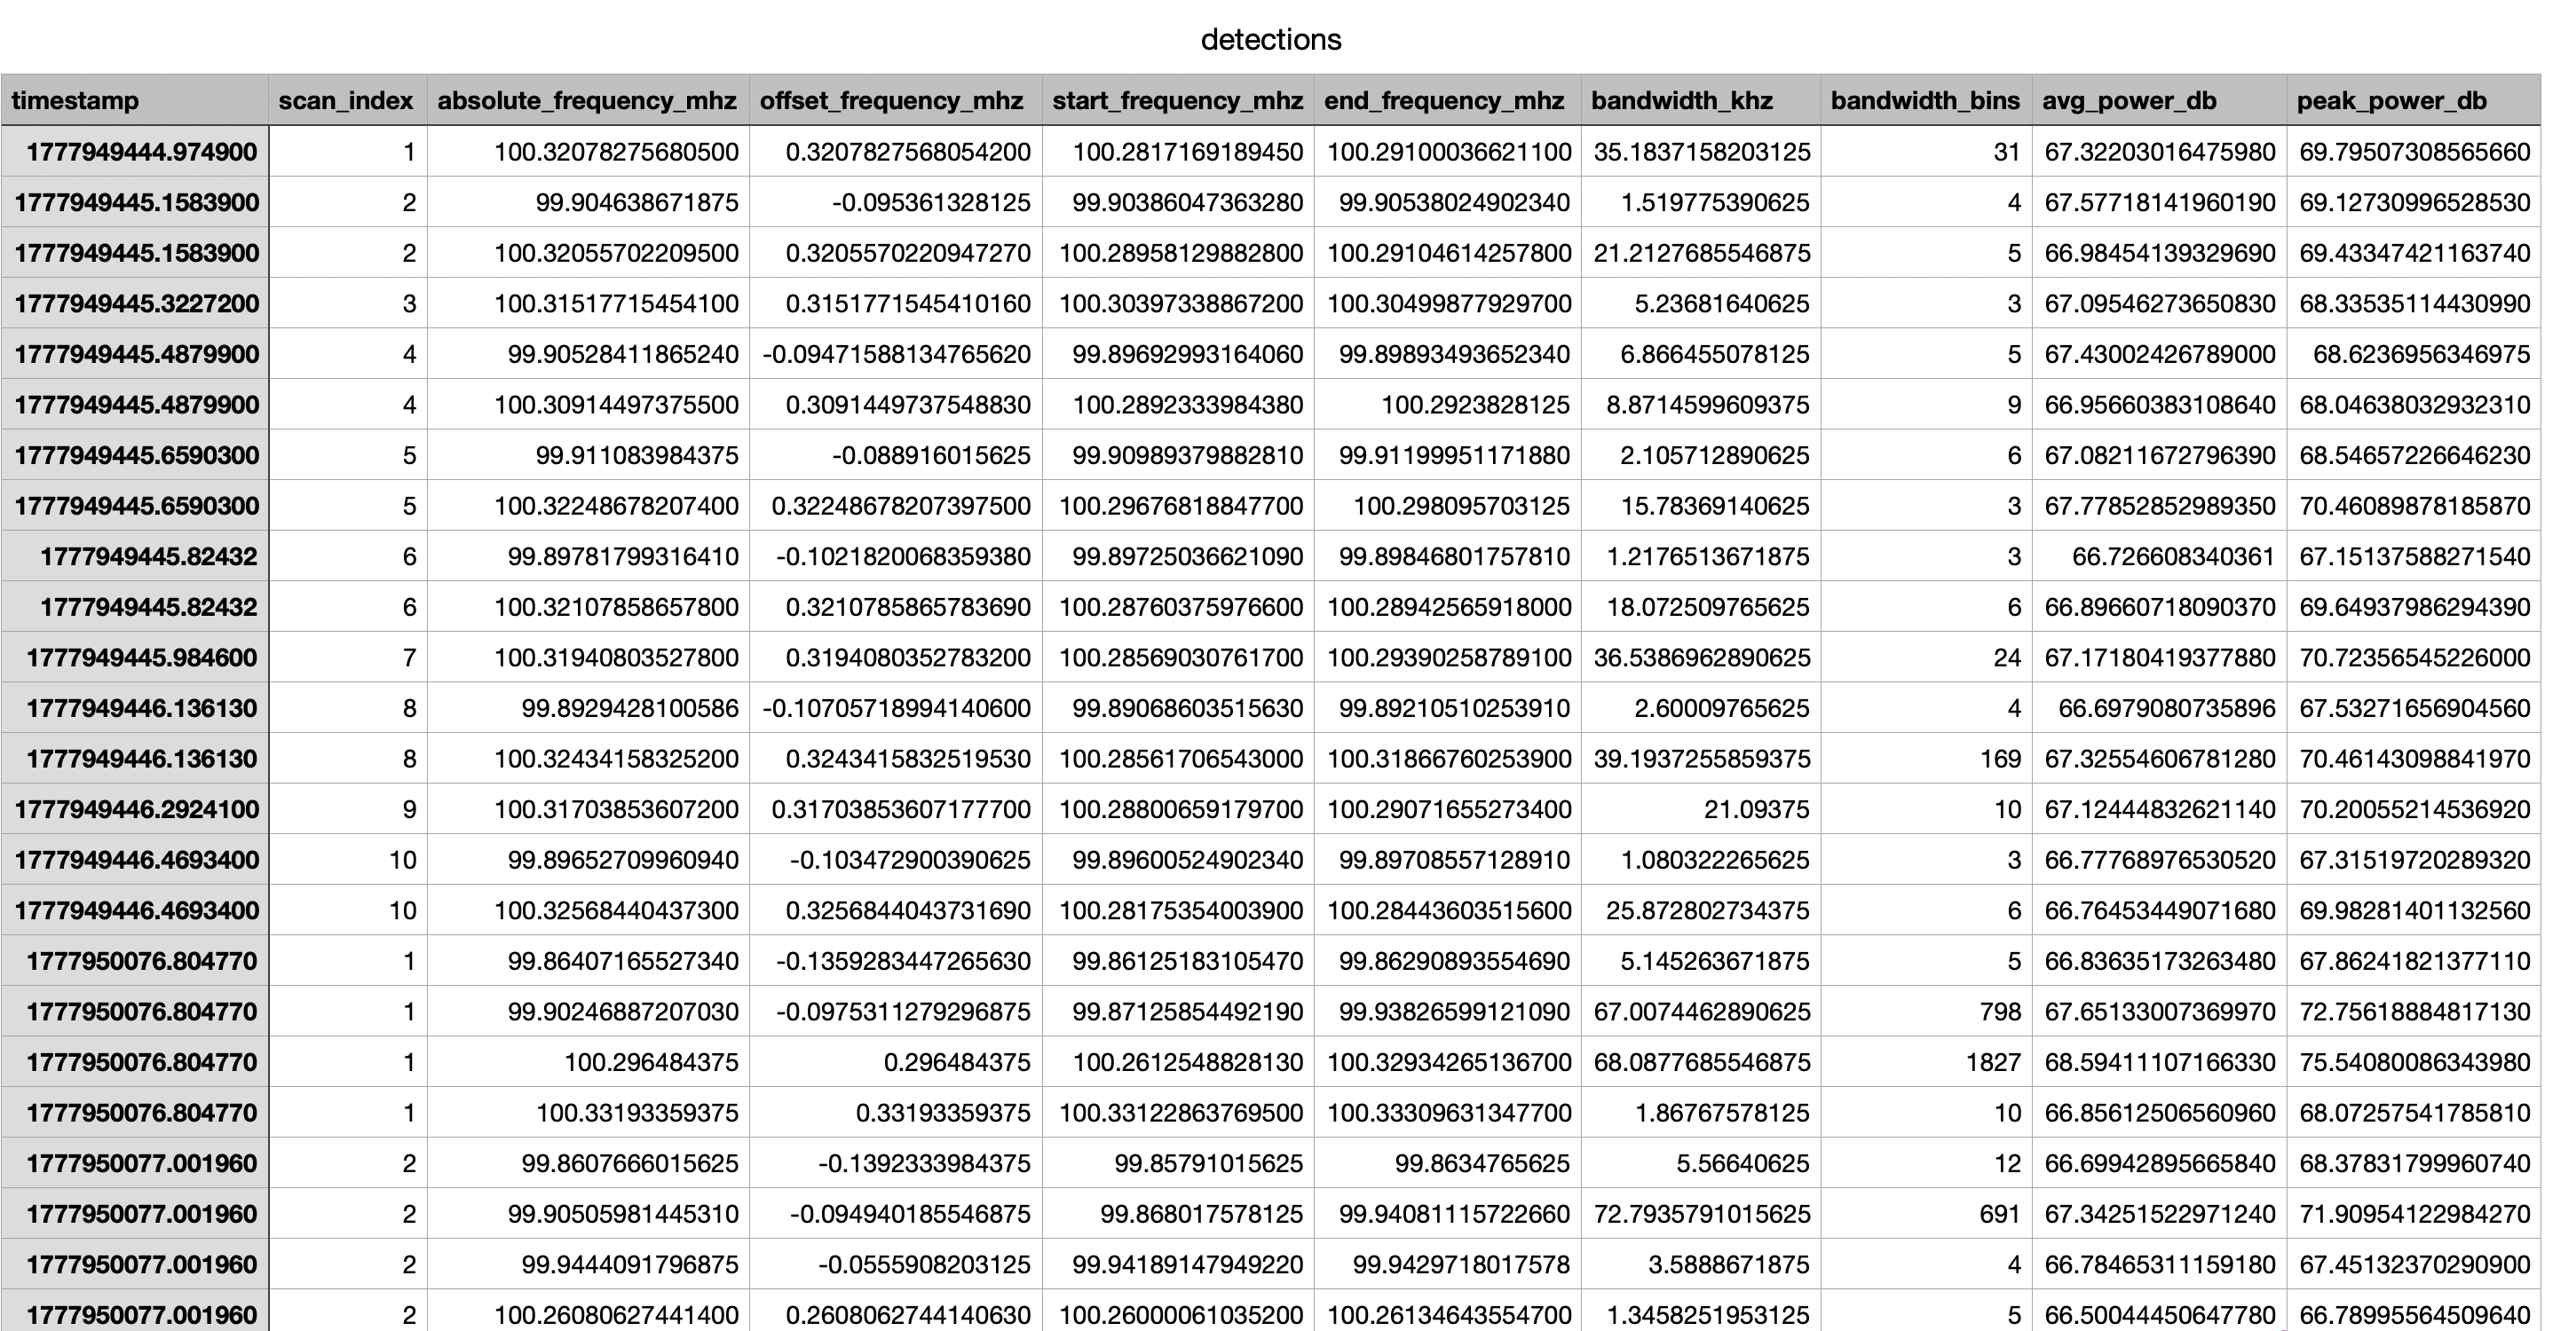
FM Receiver Experiment
After detecting persistent FM-band signals, I added an experimental FM receiver mode. This allowed the SDR to tune to public FM broadcast stations and demodulate audio. I tested this on stations such as WAMU 88.5 FM and confirmed that the system could receive intelligible speech, although audio quality depended heavily on antenna placement, gain, and signal strength.
This feature helped connect the spectrum detection output to real-world RF signals. The same antenna and SDR used for detection were also able to receive broadcast audio.
Technical Challenges
- Configuring RTL-SDR libraries and Python bindings on macOS
- Handling SDR USB read errors and device lockups
- Tuning gain, threshold, and filtering parameters for live RF data
- Filtering out the SDR center-frequency artifact/DC spike
- Reducing false detections from noise and narrow single-bin spikes
- Merging nearby detections into meaningful signal regions
- Balancing real-time processing constraints for live FM demodulation
Results
- Built a working real-time RF detection pipeline using live SDR data
- Detected persistent signal regions in the FM broadcast band
- Logged frequency, bandwidth, power, and timestamp data to CSV
- Created a persistence analysis tool to identify repeatable RF activity across scans
- Successfully received and demodulated public FM broadcast audio using the SDR
- Created a software reference model for future FPGA acceleration
Connection to FPGA Acceleration
This project serves as the software baseline for a future FPGA-accelerated signal processing engine. The most computationally important portion of the current pipeline is the DSP stage: converting IQ samples into a power spectrum, detecting threshold crossings, and identifying frequency regions of interest.
For the next phase, I plan to move parts of the FFT, power calculation, and threshold detection chain onto an FPGA. The Python implementation from this project provides a reference model for validating the FPGA output and comparing performance.
Project 1 Software Reference:
IQ Samples → FFT → Power Spectrum → Threshold Detection → Signal Candidates

Project 2 FPGA Target:
IQ Samples → FPGA FFT/Power/Detection Engine → Host-side Logging + Visualization
What I Learned
This project taught me how to connect RF hardware, digital signal processing, and software architecture into one working system. I learned how SDRs represent RF signals as IQ samples, how FFTs reveal frequency-domain activity, how to design a threshold-based detector, and how to turn noisy raw detections into cleaner signal objects through clustering and merging.
Most importantly, I built a foundation for hardware acceleration by first creating a working software reference pipeline. That gives me a clear path to compare CPU-based DSP against FPGA-accelerated DSP in the next project.